Counts

A Counts chart shows the details of data in a table as a data grid. It gives you numeric summaries of your data, both overall and selected. Learn about each Counts feature below:
Data Sheet: it's a Data Sheet!.
- A Counts view is built from a Data Sheet, so it has all of the behaviors defined for Data Sheets.
Sizes: rows and selection state.
- The top rows give the total number of rows in the data table, and the number of selected and excluded rows. Since all fields are in the same table, these numbers will be the same for each field.
For categorical fields: number of unique values, mode...
- Categorical fields are described by the number of unique values (total and selected) and the mode (most common value), total and selected.
For continuous fields: mean, standard deviation, min, max, and sum.
- Standard descriptive statistics are available: mean, standard deviation, min, max, and sum, for both the complete population and the currently selected subset.
Subsets: you can select subsets of the information.
You can filter the display to exclude (or include) types of information: simple statistics only, selected subset only.
From: "Basic View", "Selected Only" properties in the Advanced Chart Properties pane.
Zoombars: Optional scroll and zoom control.
By default, no Zoombar is displayed, but it can be useful when Basic View and Selected Only are false, so it is available on request.
From: "Show Zoombar" property in the Advanced Chart Properties pane.
Grid Specification
The layout, labels, and statistics included in a Counts chart can be customized. This is done through the "Grid Specification" property in the Properties pane for the chart (opened from the Advanced Chart Properties button in the chart toolbar).
Grid Example
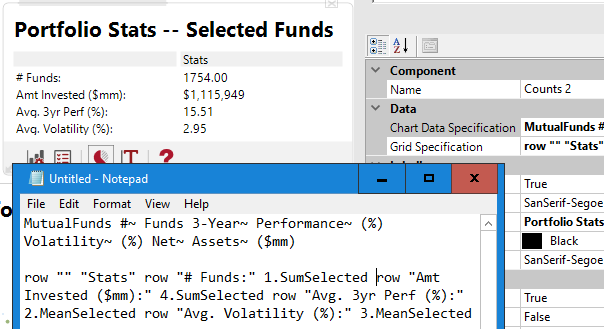
For this example, the Chart Data Specification lists 4 fields from the MutualFunds table: "# Funds", "3-Year Performance (%)", "Volatility (%)", and "Net Assets ($mm)". (Note that spaces included in field names or labels are preceded by a tilde (~) character, or the full name is enclosed in double-quote marks in the Properties pane.) The Grid Specification property defines 5 rows with 2 columns each: a static label and a statistic calculated from each of the 4 input fields (sum or average of the selected rows). The string "row" in the specification identifies the beginning of a new row in the displayed chart; tokens after that define the contents of successive columns in the chart. The first row is always displayed as a heading.
Statistics are specified like this:
[1-9].[StatisticName]
The initial number is the index of a field in the "Chart Data Specification" property, shown directly above the "Grid Specification" value. The "StatisticName" tells which statistic should be calculated. Valid choices are:
| Statistic Name | Meaning | Applies to type |
|---|---|---|
| Rows | Total count of rows in the table, regardless of selection state | Any |
| Selected | Count of selected rows | Any |
| Unselected | Count of unselected rows | Any |
| Excluded | Count of excluded (or filtered) rows | Any |
| Unique | Count of distinct non-null values in non-excluded rows of the specified field | Any |
| UniqueSelected | Count of distinct non-null values in selected rows of the specified field | Any |
| Mode | Most common value in non-excluded rows of the specified field | String |
| ModeSelected | Most common value in selected rows of the specified field | String |
| Mean | Average value of non-excluded rows of the specified field | Numeric |
| MeanSelected | Average value of selected rows of the specified field | Numeric |
| StdDev | Standard deviation of non-excluded rows of the specified field | Numeric |
| StdDevSelected | Standard deviation of selected rows of the specified field | Numeric |
| Min | Minimum value of non-excluded rows of the specified field | Numeric |
| MinSelected | Minimum value of selected rows of the specified field | Numeric |
| Max | Maximum value of non-excluded rows of the specified field | Numeric |
| MaxSelected | Maximum value of selected rows of the specified field | Numeric |
| Sum | Sum of values of non-excluded rows of the specified field | Numeric |
| SumSelected | Sum of values of selected rows of the specified field | Numeric |
Statistic names must be Capitalized as shown above.
Notice that data can come from up to 9 fields in a single table, and may be laid out in any way you wish: you do not need to put multiple statistics from the same field in a single row or column, and you do not need to lay out the table in the "column per field" layout that is used by the Counts chart by default.
If no "Grid Specification" is given, then standard statistics for each field are displayed in a separate column; the statistics displayed are governed by the "Basic View" and "Selected Only" property settings.
See also: