Charts, Pages, Dashboards
Charts display relationships in and between data.

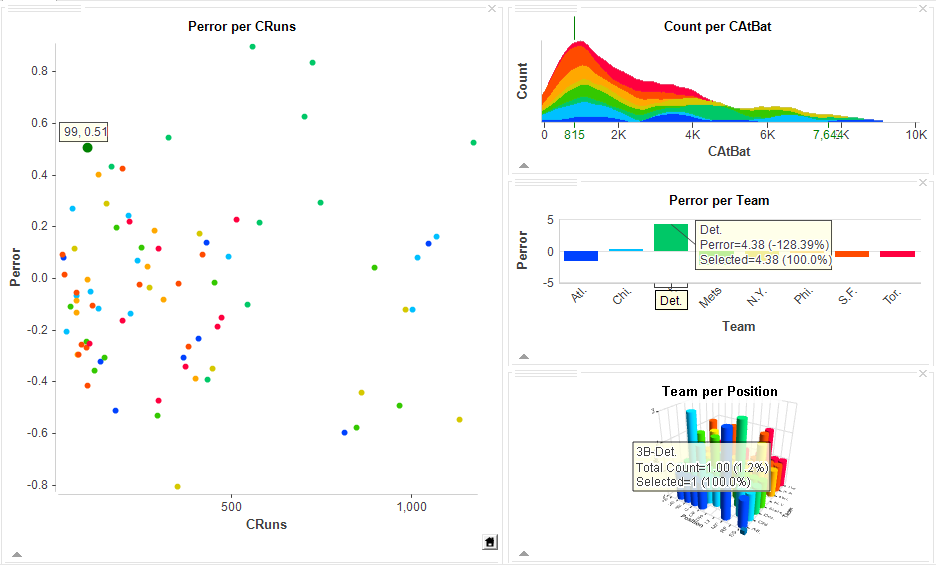
Pages are collections of charts. Through Visual Discovery, interaction and shared coloring help increase the dimensionality of your analysis.
A Page should answer a few questions.
Dashboards are collections of Pages. Through Visual Discovery, these still communicate, but separate pages may answer different questions or be different steps in an analysis process.

- Identify key Business Questions and Issues first.
- Organize charts into Pages that clearly address specific key Business Questions.
- Layer Multiple Pages into Analytical Dashboards.
- Each Page addresses one problem / issue.
- Several Pages make up a dashboard.
- The set of Pages in the dashboard become a holistic portrayal of the business area.